MapLab Get Started Manual
DM Solutions Group Inc.
Abstract
This document is a mini tutorial on using MapLab and all of its components.
Please forward questions to the MapLab user list.
Last updated: 07/29/2002
Table of Contents
Introduction
MapLab
MapEdit
MapEdit's Work Area
Opening a Mapfile
Previewing a Mapfile
Saving a Mapfile
Modifying the Map Object
Modifying the Layer Object
About Layer Objects
Removing Layer Objects
Adding Layer Objects (with Raster data)
Adding Layer Objects (with Vector data)
Adding Class Objects
Adding Labels to a Class Object
MapBrowser
MapBrowser's Work Area
Opening a Mapfile
Exploring MapBrowser
Adding a layer
Adding a Projection Object
Adding a layer when the projection has been set
GMapFactory
Creating a Project file
Creating your application
Introduction
This document describes how to use MapLab, an open source tool for the creation of web mapping applications. MapLab is comprised of three components (MapEdit, MapBrowser and GMapFactory) and offers a user-friendly alternative to manually editing mapfiles and programming PHP mapscript in the creation of MapServer applications.
This document assumes that you are a novice user of PHP mapscript and MapLab, but have familiarity with HTML code or web creation as well as some GIS terminology. This document also assumes that MapLab is installed in the following directory: c:\msapps. Finally, this document assumes that you are using Internet Explorer as your browser. If you are using another browser certain functions may not appear as described in this document.
This document is arranged as a tutorial and will take you through each application (MapEdit, MapBrowser, GMapFactory) by using an already existing mapfile called tutorial.map. To have an understanding of what is involved in the creation of a mapserver application without the use of MapLab, you can navigate to c:\msapps\maplab\tutorial and open up the file tutorial.phtml in notepad or textpad.
MapLab
Once you have
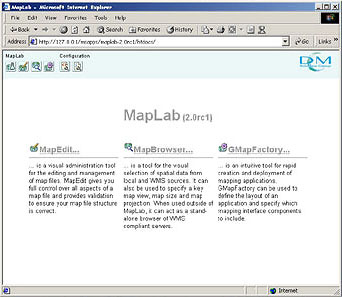
MapLab installed and configured you may go ahead and start Internet Explorer. Once your browser is opened, type in the following in the address bar: http://<server>/maplab/htdocs/ and hit enter on your keyboard. This will bring you to the MapLab introduction page. Here, you will see all three components of MapLab (MapEdit, MapBrowser and GMapFactory) and a description of what each one of them does. Read the descriptions. Look at the first four buttons on the toolbar (top left hand corner). These four buttons known as MapLab , MapEdit
 , MapBrowser
 and GMapFactory
 are a means of navigating to the various programs (you will find them in the upper left hand corner in each program).
We will begin this tutorial by first exploring MapEdit. Click on the MapEdit heading or on the MapEdit button in the toolbar.
MapEdit
MapEdit is a tool for creating, editing and managing mapfiles.
MapEdit's Work Area
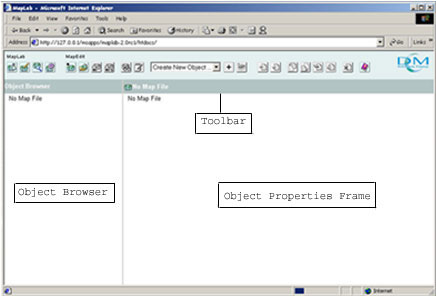
Let's start with a brief overview of the MapEdit work area. MapEdit is devised of three major parts: the Object Browser, the Object Properties Frame and the Toolbar. On the left hand side is the area known as the Object Browser and it contains the features and map layers for the map (collectively called 'Objects' in the underlying mapfile). The right hand side is known as the Object Properties Frame and it contains the information and the parameters for each of the Objects. Across the top of MapEdit is the Toolbar. The tool bar itself is divided into two parts: MapLab buttons and MapEdit buttons. The MapLab buttons will take you to the other programs in MapLab, such as GMapFactory and MapBrowser, or back to the MapLab main page. The MapEdit buttons are for performing functions specifically in MapEdit. Many of the buttons will be familiar to you, others will not. You will learn what most of these buttons do by the end of the tutorial. You will notice that some of the buttons are greyed out, this means they are currently not available to you. These buttons will become available once we have a mapfile to work with.
Opening a MapFile
MapEdit works with files called mapfiles which are the basic configuration mechanisms for MapServer. We are going to open an already existing mapfile called tutorial.map to conduct this tutorial. Move your cursor to the Open Map File button  but do not click on it. Your cursor will change from an arrow to a hand and a tool tip will appear telling you the name of the button. This feature is available for all the buttons. Now click on the Open Map File button. The Open Existing File window will appear. Navigate your way to the file tutorial.map, this is located at c:\msapps\maplab\tutorial\. Click on tutorial.map and then click on the OK button
  .
.
If you look in the Object Browser (the area on the left hand side) you will see all the objects listed that make up this mapfile. Right now you are on the Map Object. You will know this because of two clues. The first clue is that the Map Object appears in a darker colour in the Object Browser and the second clue is that you will see the name "Map" in the top left corner of the Object Properties Frame (the area on the right hand side). The Map Object is responsible for defining the application wide parameters, and is therefore a very important piece in building a mapfile. You can find out more information about the Map Object and the other objects in a mapfile by clicking on the Help button  and going to Mapfile reference v3.6. The Object Properties Frame contains all the information for building the Map Object, you will see several parameters listed in this frame for the Map Object. Try clicking on the other Objects listed in the Object Browser to see what their parameters are. You can find out more information about what each of these parameters are by clicking on the Help button and going to the Mapfile reference v3.6.
Previewing a Mapfile
Now that you have had a chance to explore the different Objects and their parameters that make up a Mapfile, let's see what type of map it makes.
- In the main toolbar click on the Preview map button
 . Another window will appear in your browser with a map of Canada. We will explore this map of Canada.
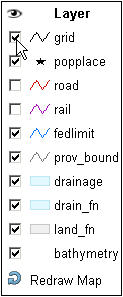
- Go to the Legend and click on the empty box next to Grid so that a check mark appears. Now click on the Redraw Map button
 , which is at the bottom of the Legend. Lines of latitude and longitude will appear over the map. Experiment with turning on and off other layers in the legend. Remember to click on the Redraw button to view your changes.
- Go to the ROSA applet (on the right hand side of the map) and you will see various tools for exploring your map. These buttons can be turned on or off by clicking on them You will know that a button is on when it is a light blue colour
 and it will be off when it is a dark blue colour
  . By default the Zoom in button is always on when you first preview the map (so it is a light blue colour). Since this button should be on (check to see if it is light blue) drag a rectangular box around the area you want to zoom in to and watch as your map reloads and zooms into that area.. Explore with the Recentre button
  to recentre the location of your map. Zoom out with the Zoom out button
  . You can also zoom back to the full map size by clicking on the Zoom to full extents button
  .
.
- Zoom into an area on the map of Canada. Go to the keymap
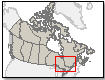 and you will see that a little red box outlines the area of Canada that you are zoomed into. Click on an area of Canada on the keymap. What happens? You will notice that the main map moves with the location of the red box.
- You may also want to experiment with the scale of the map. You can do this by going to the box titled map scale and change the number in that box. Smaller numbers will zoom you into the map, larger numbers will zoom you out of the map.
- You can also experiment with changing the extents of the map. Adjust the numbers in the min x and y and the max x and y boxes to see how it affects the map. Remember you can always click on the Zoom to full extents button to bring you back to the defaults.
- Close the window with the tutorial preview and return to MapEdit. Now that you know what the map looks like we are going to make a few changes.
Saving the Mapfile
The first change we are going to make is to save our mapfile under a different name. This way you will have a separate copy from the original.
- Click on the Save As button
 . Once the Create new file window appears, navigate to c:\msapps\maplab\tutorial. You must save your mapfile in this directory as the mapfile uses relative paths. If you attempt to save your file in a different directory you will receive a javascript alert warning you to check SYMBOLSET, FONTSET and SHAPEPATH. If you choose to save the mapfile in a new directory you must change these paths.
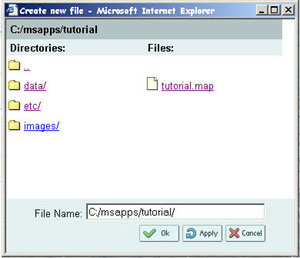
- Name this file mymap (no spaces). Now click on the OK button on the Create new file window.
- You may have noticed that this did not work. In fact, in the top right hand corner of the Object Properties Frame you will find an Alert symbol
 . Click on the Alert symbol. The Error occurred window will appear with a message stating that there was an error in saving because the extension .map was not used with the file name. Every time you make a new mapfile you must add this extension to the end of the filename.
- We will try saving the mapfile again. Click on the Save As button. Navigate to the c:\msapps\maplab\tutorial. Name the file mymap.map (no spaces) and click OK.
- Now every time you wish to save your mapfile, you can click on the Save button
 .
.
Modifying the Map Object
We are going to make a few changes to the Map Object
- Make sure that you are in the Map Object. You will know that you are, as it will appear in a darker colour in the Object Browser than the other objects and the name "Map" will appear in the upper left hand corner of the Object Properties Frame.
- The first change we are going to make is to change the name of the map from Demo to something that better reflects our map. Go to the Name parameter and delete the name Demo and replace it with Map of Canada. This name will not appear on your map but it will better reflect what your map is about in the Object Browser. This may be important if other people are working on the same mapfile and want to quickly know what the map is about without having to preview it.
- Let's also change the size of the map. Go to the parameter that says Size. In the width box delete the number 400 and change it 600 and in the height box change the height from 300 to 450.
- Now, click on the Save button .
- To see what your changes have done, click on the Preview map button . You will notice that your map is no longer called tutorial but is now called mymap, the name you gave it when we re-saved the mapfile. You will also notice that the size of the map is significantly bigger.
- Keep your preview of the map open. We are going to make changes to the map size on the fly and see what they look like before we save them. Change the size of the map to 1000 by 750 and hit the Apply changes button
 . This button does not save your changes but allows you to see what your map will look like if you make changes to the mapfile. To see the changes, go to the map preview window and hit the Redraw button at the bottom of the legend.
- Close the preview. Since the size is obviously too large we are going to change the map back to 400 by 300.
- Hit Save.
We will not worry about the following objects: Reference, Query map, Legend or Scalebar but you can read up on those objects by clicking on the Help button and going to Mapfile reference v3.6
Modifying Layer Objects
You will notice that there are several Layer objects in your Mapfile (bathymetry down to grid). Layer objects describe the layers used in the mapfile. If you preview your map and go to the legend, you will see everyone of your Layer objects in the legend. Layer objects are made up of GIS data, they can be either raster or vector data and can be made up of several data types including: ArcView shapefiles coverages, MapINFO Native and MID/MIF, Intergraph DGN, GIF, JPEG, PNG, TIFF/GeoTIFF, ERDAS, ArcSDE, Oracle SDO and PostGIS.
About Layer Objects
- Click on the bathymetry layer. You will know that you are on the bathymetry layer because it appears in a darker colour than the other layers and the name "layer" will appear in the upper left hand corner of the Object Properties Frame.
- Have a look at the parameters for this object and you will notice that it is a .tif file and therefore it is a raster file as indicated in the Data type parameter.
- You will also notice that underneath the bathymetry layer there is a Metadata Object. Click on it. The metadata describes the data, in this case it tells us that this data file provides information on bathymetry as well as elevation. You may also notice there are is a little x next to each of the fields in the metadata. The x is a way of deleting a field if you do not want it in your metadata.
- Click on the popplace layer. This is vector data and we know from the Data type that it is a point file. Popplace also has a metadata Object, however, below this metadata Object are two Objects not contained under the bathymetry layer. These two Objects are called Class Objects; all vector data (like popplace) require at least one class Object. As bathymetry is raster data it does not require a class Object.
Removing Layer Objects
We are going to delete both of these layers to go through the process of adding both a raster and a vector layer into MapEdit.
- Click on the popplace layer so it is selected. To ensure you have the popplace layer selected, look for the two clues that let you know which Object you are on. Now click on the Remove Object button
 .
.
- Now remove the Bathymetry layer. Click on Save.
- Let's see what our map looks like without these two layers. Click on the Preview map button. You will notice that information about elevation and bathymetry are missing as well as the provincial capitals and national capital of Canada. You will also notice that bathymetry and popplace are missing from the legend.
Adding Layer Objects (with raster data)
We will now go through the process of adding the bathymetry layer back to our map. As you will remember, the bathymetry layer was made up of raster data.
- Click on the Map Object in the Object Browser. Make sure you have the Map Object selected.
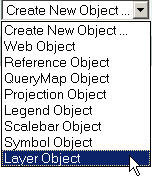
- Use the drop down menu in the tool bar and change Create New Object to Layer Object. Click on the Add new item button
 to add a new layer object.
- You will notice that a new layer appears at the bottom of the Object Browser, it is called layer(). We are going to use this layer to re-add the bathymetry layer. Click on it now.
- The first step is to add the bathymetry file to the layer. Go to the parameter called Data and type bath_mapserver.tif.
- Now, we must give this layer a name. This name will appear in the Object Browser as well as the Legend, so you will want to give layers name that accurately describe what they show. Go to the Name parameter and type in bathymetry in the empty field.
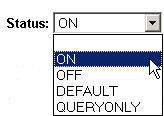
- We must also say whether we want this file to be automatically on when someone visits the map, or whether we would like it off and have the users turn it on in the legend (remember the check mark?). We are going to make the bathymetry layer be automatically on. Go to the Status parameter and using the drop down menu, select On.
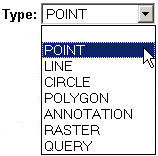
- The next step is to describe what type of data this is. As mentioned previously, this is raster data, so go to the parameter named Type and using the drop down menu select Raster.
- Click on Save.
- Let's have a look at your map now. Click on the Preview map button. You may notice that your bathymetry layer now covers all the other layers. This is because of two reasons, one is because the spatial coverage of the layer and the other is its placement in the Object Browser. Since the bathymetry layer covers all of Canada, it will hide some of the other smaller layers, therefore we need to place the layer so that the other layers overlay on top of it. Currently, our bathymetry layer is on top of all the others, hiding them. The reason for this is because when MapEdit builds our map it builds the objects from top to bottom as listed in the Object Browser, since the bathymetry layer is on the bottom, it gets built last, meaning it is the last layer to be placed on the map.
- We need to move the bathymetry layer up so that it is the first layer listed in the Object Browser (i.e. above the land_fn layer). Click on the bathymetry layer to select it. Now click on the Promote Object button
 . You will notice that with one click it has moved up in the Object Browser. Keep clicking on the Promote Object button until it is above the land_fn layer (foreign land) and below the Scalebar Object. If you need to you can use the Demote Object button
  to move the bathymetry layer down.
- Hit the Save button.
- Click on the Preview map button to see what the map looks like now that you have moved the bathymetry layer. You should see that the other layers are now visible. Close the Map Preview window.
- The final step is to add metadata to our layer. Click on the bathymetry layer so that it is selected. Go to the toolbar and using the drop down menu change Create New Object to Metadata Object. Click on the New item button . You should see a metadata layer appear below the bathymetry layer.
- Click on the metadata layer. We need to add some information to the metadata. To do this, use the drop down menu and change it to Add new metadata and click on the New item button. Under the heading parameter type Description and under the heading value type Elevation/Bathymetry. Now click on the Apply Changes button..
- Hit Save.
Adding Layer Objects (with vector data)
We will now re-add the popplace layer to our map. As you will remember, popplace is composed of vector data and therefore it contains some objects that the bathymetry layer does not. We will also make changes to this layer so that only Ottawa, the capital of Canada is displayed.
- We need to add the popplace data to our mapfile. Use the same method you did before to add a new layer object. If you have forgotten, please refer back in the notes.
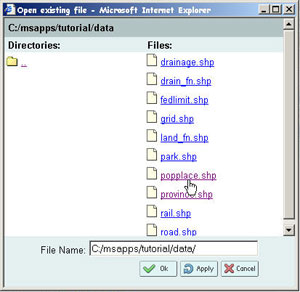
- Click on the new layer at the bottom of the Object Browser. Once the properties for that layer opens, click on the Select a File button
 next to the Data Type parameter. The Open existing file window will appear and will immediately take you to the data folder for mymap.map. Here, you will see all the shapefiles used in this mapfile. Click on popplace.shp and then click OK.
- Instead of naming this layer popplace we are going to change the name to capital. In the Name parameter type capital.
- Now we must decide whether or not we want this data to be on or off. In this case we want this data to be off and the user will have to turn it on in the legend. Go to the Status parameter and using the drop down menu choose off.
- Finally, we must specify what type of data this is. Since this is vector data we must indicate whether or not this data comes in the form of points, lines, or polygons. The popplace.shp is a point, so using the drop down menu choose point.
- Since we want the capital layer to be one of the last layers drawn on the map, its location in the Object browser is fine. We, therefore, do not need to promote it.
- Click on Save.
- Click on the Preview Map button and see what the changes have done. Click in the empty box next to capital in the legend and click on the Redraw map button . Did the capital appear? It did not appear because we have not classified the data. As mentioned previously, all vector data need class Objects.
Adding Class Objects
In this next section you will learn how to add class Objects to vector layers.
- Click on the capital layer so that it is selected. Use the drop down menu in the toolbar and change Create New Object to Class Object. Now click on the Add new item button. You should see a class object appear underneath the capital layer.
- We need to give the class a name that indicates what it being classified. Since we are going to classify this layer so that it only shows the capital of Canada type capital in the Name parameter.
- The popplace.shp file contains information on many of the cities of Canada, however we only want Ottawa to be displayed on our map. To do this you need to add information to the Expression parameter so that only Ottawa is visible. To find out what type of information we need to add, you can open up the popplace.dbf file in a GIS program or a spreadsheet program like Excel. Once you are in one of these programs, navigate to c:\msapps\maplab\tutorial\data\ and open up popplace.dbf. The table that opens contains all the information for the popplace.shp. Look for the heading Name and either scroll down until you find Ottawa or do a find for Ottawa. Once you have found Ottawa look for the heading Capital. All cities are categorized in this heading as either a 0 (non-capital) a 1 (national capital) or a 2 (provincial capital). You will see that Ottawa is categorized as a 1. Close the spreadsheet program or the GIS program you were using and return back to MapEdit.
- Since the number 1 represents national capitals (hence Ottawa), go to the Expression parameter and type in 1.
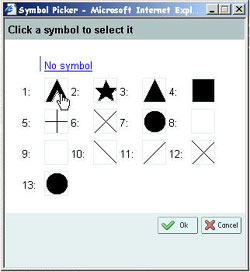
- We also need to provide a symbol to mark Ottawa on the map. Go to the Symbol parameter and click on the Select a symbol button
 . The Symbol picker window will appear. Click on a symbol that you would like to represent Ottawa and then click OK.
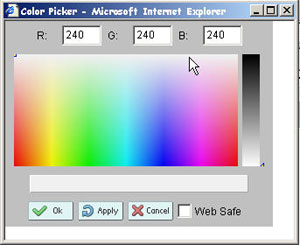
- Now we need to select a colour for our symbol. Go to the Colour parameter to pick a colour. You can either enter in numbers or you can click on the Select a colour button
 .
.
- Once you have chosen a colour, look at both the symbol and colour parameter and you will notice their buttons display the colour and symbol you picked.
- The final step is to choose the size of your symbol. Scroll down the Object Properties frame until you see a parameter called Size (it is below the backgroundcolour parameter). In the empty field type 12.
- Hit Save.
- One more step to complete so that the city of Ottawa is displayed on our map. Return to the capital layer by clicking it.
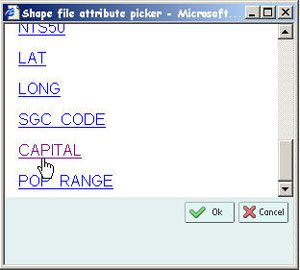
- Scroll down the list of parameters in the Object Properties Browser until you see a parameter called ClassItem. In this parameter we need to indicate what heading in the .dbf file we are using to classify our capitals. As you will recall the heading we used was called Capital. You can either type the name capital into the ClassItem parameter or click on the Select a file button. The Shape file attribute picker window will open. Scroll down until you see the heading capital, click on it and hit OK.
- Hit Save.
- Now click on the Preview map button and turn the cities layer on in the legend. You will see a symbol for Ottawa along the Quebec/Ontario broader.
Adding Labels to a Class Object
There is one missing piece to our map. We should add a label to show the name of the capital city of Canada.
- Click on the Class Object underneath the capital layer. Use the drop down menu in the toolbar and change Create new object to Label Object. Click on the Add new item button.
- Now click on the Label Object that appears underneath the Class Object.
- The first thing we need to do is to pick a font that we want our label to be written in. Click on the Select font
 button. The Font picker window will appear. There are several fonts listed, pick one that you think is appropriate.
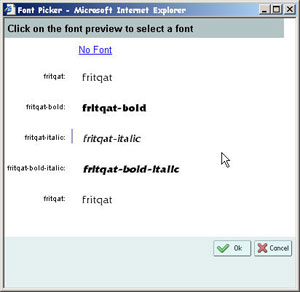
- Now we need to determine whether this font is truetype or bitmap. Go to the Type parameter and using the drop down menu choose truetype.
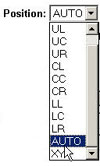
- Next, we need to decide where we want to position the label on the map. Go to the parameter called Position and using the drop down menu choose Auto. You can read up on what the other position do by clicking on the Help button and choosing MapServer reference v3.6.
- Go to the parameter called Size, here we will choose the size of the font. You can do this in two ways. You can either use the drop down menu and choose from the sizes listed there (small, medium, large etc.) or you can type a number in the box titled integer. In the box titled integer enter in the number 8
- We now need to give our font a colour. Go to the Colour parameter and click on the Select a colour button and choose a colour for your font.
- Hit Save.
- Click on the Preview map button to see what your map looks like now. Do not forget to turn on the capital layer.
- You may have noticed that the label does not appear on your map, this is because we have one more step to complete. We need to tell our capital layer which field to use to get the name of our city.
- Click on the capital layer to open it up.
- Scroll down the Object Properties Frame until you see a parameter called LabelItem. Click on the Select a file button and click on Name. If you remember from the popplace.dbf file the name Ottawa was located underneath the Name heading.
- Now hit Save.
- If your preview your map you should see the label.
MapBrowser
MapBrowser allows you to select spatial data from local and WMS servers.
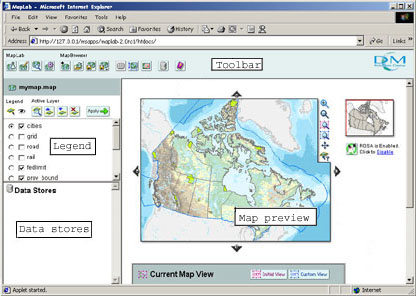
MapBrowser's Work Area
MapBrowser is made up of four distinct areas: the toolbar, the legend, the data stores and the map preview area. The toolbar can be found across the top of the window and it is divided into MapLab buttons and MapBrowser buttons. The legend is in the upper left hand corner and contains all the map layers. The data stores lists all the servers that are available to include data from and the map preview area displays your map.
Opening a Mapfile
- If you are in MapEdit, click on the MapBrowser button . If you had the mymap.map file open, this file will automatically be displayed in MapBrowser.
- If you are not in MapLab go there now and click on the MapBrowser heading. To open a file click on the Open Mapfile button . Navigate to the directory that contains mymap.map. Click on it and hit OK.
Exploring MapBrowser
Let's take a moment to explore MapBrowser
- You can use the arrows
 surrounding the map to move the map to the north, south, east and west.
- To return the map back to the initial view, click on the Zoom to Initial View button
 on the ROSA applet.
- You can also use the Zoom in and Zoom out button to explore the map. Like the preview map in MapEdit, these buttons can be turned on or off. You will know that the Zoom in button is on when it is a light blue colour and it will be off when it is a dark blue colour . To zoom into an area, click on the Zoom in button so it is a light blue colour. Drag a rectangular box around the area you want to zoom in to and watch as your map reloads and zooms into the area you chose.
- Another interesting feature of MapBrowser is that you can set a custom view. This feature is useful if the map layer you are adding has a much smaller extent than the map. Instead of continually searching and zooming into the map layer you can set the custom view to easily view that map layer. Zoom into Newfoundland and click on the Set Custom view button
 . This sets your custom view so you can return to Newfoundland after you have zoomed in and out of other areas on the map. Now click on the Zoom to Initial View button in the ROSA applet to return to the full map. If you click on the Zoom to custom view button
  in the ROSA applet, you will return to Newfoundland.
Adding a layer
Before we can add a layer we must first install a server, where we can obtain different map layers to add to our map.
- We are going to add a layer from one of the WMS servers. The first thing we need to do is connect to a WMS server. Click on the Manage servers button
 . The Manage servers window will open.
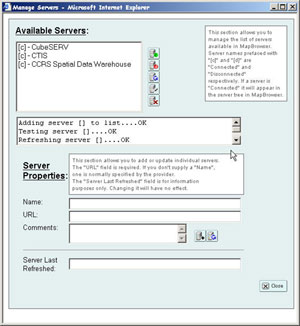
- If you look in the Available Servers box you will see that there are several servers available to you. However we will add the DM Solutions Group's WMS server from where you will obtain data. To do this type the following URL in the URL field: http://www2.dmsolutions.ca/cgi-bin/mswms_gmap?. Then hit the Add Server button
 . You should see in the Available Servers window that the GMap WMS Demo Server has been added to the list of available servers. A (c) will be next to the server name indicating that you are connected to that server. Click on the Close button
  .
.
- If you look in the data stores section of MapBrowser (bottom left hand corner), you will see that GMap WMS Demo Server has been added. Click on the plus symbol
 next to this server.
- GMap WMS Demo Server will appear underneath, click on the plus symbol next to its name. When you do, you should see the following layers listed below:
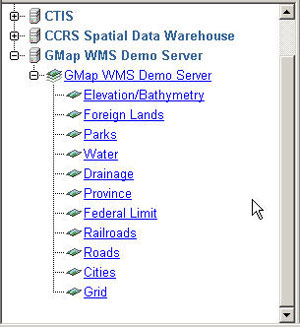
- Most of these layers are already on your map. However, the one layer that is not is the parks layer. Click on the parks layer to add it and then hit the Apply button
 .
.
- You may notice that nothing happened and that an Alert symbol appeared in the upper left hand corner of MapBrowser. Click on the Alert symbol to open up the Error Occurred window. The error message tells us that the projection has not been set. For layers to be added in MapBrowser, a Projection Object must be added to the mapfile.
Adding a Projection Object
In this step we will go to MapEdit and add a Projection Object.
- Click on the MapEdit button in the toolbar to return to MapEdit. Your mymap.map file should already be open.
- Click on the Map object and ensure that it is selected. Then go to the drop down menu in the toolbar and change Create new object to Projection Object. Click on the Add new item button.
- A Projection object should appear underneath Querymap and above Legend. Go to the Projection Object and click on it.
- We are going to add the following code in the Project Attributes box: init=epsg:42304. This information says that we want our map of Canada to be in the Lambert Conformal Conic (LCC) projection for Canada.
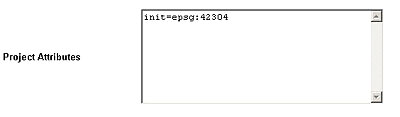
- Hit Save.
- We are now ready to return to MapBrowser. Click on the MapBrowser button in the toolbar.
Adding a layer when the projection is set
In this next section we will make a second attempt to add the parks.
- Click on the plus symbols next to the GMap WMS Demo Server until all the layers appear. Now click on parks and then hit the Apply button .
- You will notice that the parks layer appears above the capital layer in the legend. The radio button next to the layers tells us whether or not the layer is active. If a dot appears in the radio button it means it is active and can be manipulated
 . The box next to the layer tells us whether or not the layer is visible on the map. If a check mark appears in the box the layer is visible
  .
.
- Looking at our parks layer, we can see that the layer is visible. For example, we can turn off the parks layer by clicking on the layer visibility box and removing the check mark. To make this change click on the Apply button.
- We can also see that our layer is active. When a layer is active we can manipulate it. For example, because the parks layer is active we can use the Promote
 and Demote
  buttons to move the layer up and down. Or use the Delete active layer button
  to delete the layer. You may notice that the layers in MapBrowser are listed differently than in MapEdit. Here, the layers to be drawn first are at the bottom and the layers to be drawn last are at the top. Since we do not want parks to be the first layer drawn on the map (where it might hide other layers), we should demote it. Use the Demote button to move the parks layer from the top to above the land_fn (foreign land) layer and below the drain_fn (foreign drainage layer).
- You may also notice that there is an information button
 next to the parks layer. This informs us that this layer is queryable. Turn on the visibility of the parks layer and hit the Apply button. Go to the ROSA applet on the map and click on the Point query button
  . Now click on one of the parks, you should see tiny cross hairs on the park. The Query results window will appear providing information about the park, like the park name and its area.
- Click on the Save button.
GMapFactory
GMapFactory is a tool for rapid creation and deployment of mapping applications. In this tool you will be able to assemble all the parts to create your web mapping application such as: the mapping tools to use (i.e. ROSA applet), the layout of the application, and the design of the application.
Creating a project file
The first step is to create a folder to contain your project in. There are two ways to create an application depending on whether or not you already have an application open in MapLab. We will first describe what to do if you are already in MapLab with mymap.map open (steps 1 and 2) and then we will go on to describe what to do if you need to start MapLab and open your mymap.map mapfile (steps 3 and 4).
- If you are still in MapBrowser click on the GMapFactory button this will open GMapFactory. The Quick Launch dialogue box will appear in GMapFactory saying that a project has not been selected yet. However it will already have a link to your mymap.map in the map file field.
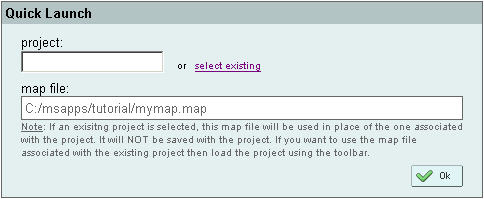
- Click on the link called select existing next to the project field. This will open up the GMapFactory window. In the top of the window will be a path describing the location of the project. Make a note of this location. Close the GMapFactory window. In the project field type mymap_project and click OK. This will be the name of your folder. You can now move on to the section titled Creating your application.
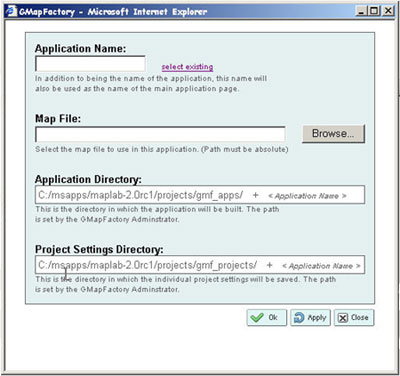
- If you are not in MapLab or do not have mymap.map open, go to MapLab now and click on the GMapFactory heading. When GMapFactory opens, click on the Open existing file button
 in the toolbar. The GMapFactory window will appear. Where it says Application name, type mymap_project. Where it says Map File click on the Browse button
  and navigate to where your mymap.map file is located. Click on it and then hit OK.
- GMapFactory will take a moment to create the application.
Creating your application
Creating the layout of your application is fairly simple. GMapFactory is divided into several sections each pertaining to a certain section of the map. We'll move through each of these section to find out what they do.
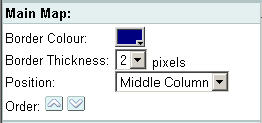
- In the main map section you can choose the colour of the border surrounding your map by clicking on the Select a colour button. You can also choose the thickness of the border by clicking on the drop down menu next to border thickness. Finally, you can adjust the position of the map on the application by using the drop down menu next to position. Experiment with these three functions. Remember to click the Apply button to see what the application will look like.
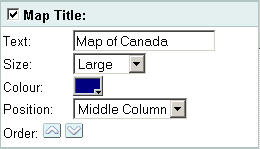
- In the map title section, you can decide whether or not you want a title by clicking the box next to map title to remove the check mark. For this tutorial leave the map title visible. In the text box type in Map of Canada. This will be the title that appears on our mapping application.. The drop down box next to size determine the size of font you want to use for your title. You can also pick the colour of the font for your title and its position on the application. Experiment with all three of these functions.
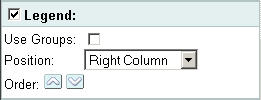
- The legend section affects what the legend will look like in your application. Like the map title section you can choose whether or not to have your legend visible by clicking on or off the check mark. The User Groups box allows you to enable groups in your legend display, for example you can create the group water and under water list the layers rives, lakes and oceans. However, to enable user groups you must set up groups in the mapfile. Since we have not done this, we will leave this option alone. You can also decide the location of the legend on your application.
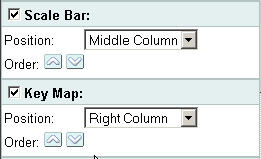
- In the scale bar section and key map section you can use the drop down menu to determine their locations on the map.
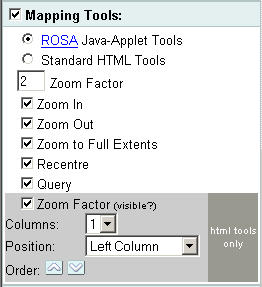
- In the mapping tools section you can decide which tools you want in your application. For example, you may decide that you do not want the ROSA applet but you only want HTML tools displayed. You can also click on or off the various tools, like the zoom in button to determine whether or not you want them on your application. In the Zoom factor box you can decide how far the zoom in or zoom out button will zoom. If you are using HTML tools instead of the ROSA applet, you can use the drop down menu to decide where to position them on your map.
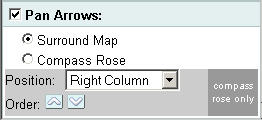
- In the pan arrow section you can decide whether or not you want your pan arrows to surround the map or be assembled into a compass rose. If you chose the compass rose you can also decide where you would like to place it on your map by using the drop down menu.
- Look at the heading called order, which is in each of the sections, and you will see up and down arrows. They are called the Promote button
 and the Demote button
  . These buttons change the order of the objects in the same column. For example if you have the legend and the keymap position in the left column you can use the promote and demote buttons to move the legend above the keymap.
- Once you have your application assembled. Hit the Save button.
- There is one final correction to make on your application. If you look at your parks layer you will see it is oddly named in the legend. To provide this layer with a more proper name return back to MapEdit by clicking on the MapEdit button.
- When MapEdit opens, find the layer GMap_WMS_Demo_Server-park layer in the Object Browser and click on it. In the Name parameter change the name to park.
- Hit Save.
- Now return to GMapFactory. You will see that the parks layer is now properly named.
Congratulations, your application is now ready to be published on the web.